Seismic Exploration Lab
(A.K.A Aunt Jemima Syrup in a Sandbox Lab)
Goal
The goal of this exercise is to learn how oil companies create profit and the budget that they have to stick to throughout their drilling process.
Materials
o Oil field (from part one)
o Map/Table (from part one)
o Markers
o Ruler
o Chopsticks
o Toothpick
o Tape
o Reservoir Volume and Recovery Rate Cards
Procedure
1. Measure and mark each centimeter on the chopstick
2. Attach the drill bit (the toothpick)
3. Select the location for the first drill site and drill straight down. Make sure to note the depth of the drilling bit (in cm).
4. Record the cost associated with the first site and the depth you drilled.
5. If there was no oil, select another site and repeat the process (make sure to record all costs).
6. After oil is discovered, inform the site foreman (Mrs. Ogo/Mr. Greg), select a reservoir and recovery rate card and calculate the total money spent and generated by this site.
How to play:
• Each team will use the oil field map they created using the seismic data provided by the
Kearny Geological Solutions field team.
• The team will choose a grid square in which to drill, following the rules above.
• Once the team has located the oil, they draw a card representing the size of their
reservoir (between 5 and 8 km3) and the recovery rate of the oil (between 25% and
50%). They can then calculate the amount of oil in the reservoir and the amount of oil
extracted.
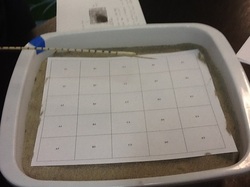
To test out whether our estimates for density and ideas for where to drill were correct, each table was given a box of sand with a map of the area we were supposed to be "analyzing" over it, given a toothpick, and to search for the "oil" that was underneath. My team drilled to the bottom twice and did not get any results, costing us 100 000 dollars in fake money for each centimeter drilled, amounting in a large amount of money lost. Finally, we drilled at D2 and struck oil.
Lab Questions
1. Was your oil exploration operation profitable? Why or why not?
NO WAY!!
2. Did your oil exploration and recovery efforts make money? Discuss which variables would you want to change to make your business more profitable.
The family car did make money. However, they did not get a lot, compared to the other teams. The variables that the family car would want to make were to change fate. Sabrina wanted to get different reservoir and recovery rate cards.
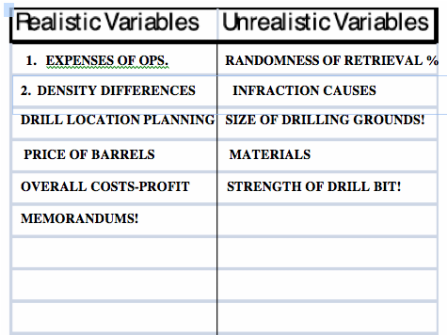
3. Complete the "T-chart" below to show which aspects of this simulation were realistic and which aspects did not mimic reality. Discuss how some of these variables were unrealistic.
The goal of this exercise is to learn how oil companies create profit and the budget that they have to stick to throughout their drilling process.
Materials
o Oil field (from part one)
o Map/Table (from part one)
o Markers
o Ruler
o Chopsticks
o Toothpick
o Tape
o Reservoir Volume and Recovery Rate Cards
Procedure
1. Measure and mark each centimeter on the chopstick
2. Attach the drill bit (the toothpick)
3. Select the location for the first drill site and drill straight down. Make sure to note the depth of the drilling bit (in cm).
4. Record the cost associated with the first site and the depth you drilled.
5. If there was no oil, select another site and repeat the process (make sure to record all costs).
6. After oil is discovered, inform the site foreman (Mrs. Ogo/Mr. Greg), select a reservoir and recovery rate card and calculate the total money spent and generated by this site.
How to play:
• Each team will use the oil field map they created using the seismic data provided by the
Kearny Geological Solutions field team.
• The team will choose a grid square in which to drill, following the rules above.
• Once the team has located the oil, they draw a card representing the size of their
reservoir (between 5 and 8 km3) and the recovery rate of the oil (between 25% and
50%). They can then calculate the amount of oil in the reservoir and the amount of oil
extracted.
To test out whether our estimates for density and ideas for where to drill were correct, each table was given a box of sand with a map of the area we were supposed to be "analyzing" over it, given a toothpick, and to search for the "oil" that was underneath. My team drilled to the bottom twice and did not get any results, costing us 100 000 dollars in fake money for each centimeter drilled, amounting in a large amount of money lost. Finally, we drilled at D2 and struck oil.
Lab Questions
1. Was your oil exploration operation profitable? Why or why not?
NO WAY!!
2. Did your oil exploration and recovery efforts make money? Discuss which variables would you want to change to make your business more profitable.
The family car did make money. However, they did not get a lot, compared to the other teams. The variables that the family car would want to make were to change fate. Sabrina wanted to get different reservoir and recovery rate cards.
3. Complete the "T-chart" below to show which aspects of this simulation were realistic and which aspects did not mimic reality. Discuss how some of these variables were unrealistic.
Summary
4. What was the purpose of this activity? What were some things you learned about oil exploration and extraction?
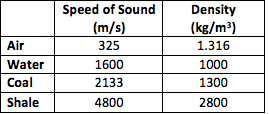
I think that the purpose of this activity was to help us to relate to the SOP's (Standard Operating Procedures, military term) of real-life oil companies, as well as the planning, executing, and reflecting phases of the activity. I learned about the types of density maps that are used to locate the most likely oil spots, and how oil extraction is planned.
4. What was the purpose of this activity? What were some things you learned about oil exploration and extraction?
I think that the purpose of this activity was to help us to relate to the SOP's (Standard Operating Procedures, military term) of real-life oil companies, as well as the planning, executing, and reflecting phases of the activity. I learned about the types of density maps that are used to locate the most likely oil spots, and how oil extraction is planned.
