GNOME OIL SPILL SIMULATION ACTIVITY
Goal: After simulating an actual oil spill event, you will understand how oceanographers help to
protect marine resources from pollution such as oil spills. You will use an actual modeling
program, GNOME, to observe and predict oil spill trajectories. You will understand how
weather and ocean conditions affect the fate of oil transport, and how modeling these conditions
can help remediation efforts.
Materials: GNOME (General NOAA Operational Modeling Environment) installed with a location file. In this case, we use the Santa Barbara location file. Also required are a pencil, lab sheet and the “GNOME" manual.
PART 1
Warm up: Re-Create the Santa Barbara Oil Spill of Jan 28, 1969.
The goal in part 1 is to test the model. Does it work? Can we actually use it? Scientists call this
“hindcasting” (rather than forecasting). Hindsight is 20-20!
These are the parameters that my partner and I put into the GNOME software to recreate the Santa Barbara Oil Spill:
- Model Run Duration: 3 days
- Weather conditions:
Current: Davidson current (“Relaxation state”)
Wind: Variable
Day 1: NNW, 10 Knots (Auto-increment by 24 hours)
Day 2: WNW, 10 Knots
Day 3: WSW, 15 Knots
- Spill location: 34° 19’ 54’’ N and 119° 36’ 47’’ W
- Spill amount: 100,000 barrels (non-weathering)
After running the advanced simulation, we answered the following questions:
1. Does the spill you modeled agree with the local account of the actual Santa Barbara oil spill (below). List some similarities and differences between the model and the observations of the actual spill:
"Santa Barbara was experiencing a stormy winter, with a large flood event having occurred in January 25th, just three days before the blowout. Enormous amounts of freshwater were still running offshore from local streams, flowing south and southwest in the vicinity of the rig. Combined with the prevailing north-north-westernly winds typical of the area between storm systems, this pushed the expanding oil slick away from the shore, and it seemed for a few days that Santa Barbara would be spared. However, another huge storm system affected the region on February 4th, with winds moving around the compass clockwise from southeast to west; this pushed the oil slick north into Santa Barbara harbor and onto all the beaches of southern Santa Barbara County and onto all the beaches of southern Santa Barbara county and northwestern Ventura county"
Yes, I think that the spill we modeled in class with "GNOME" agrees with the first-hand account of the actual oil spill. The wind directions and speeds were the same, and the resulting oil coverage of the shore of Santa Barbara was very similar. One factor that was not taken into account was the streams and rivers that were coming from inland and keeping the oil offshore. Other than that, I think that the spill we modeled was very similar to the spill of 1969.
But What If It Happened TODAY?!?!?!? --PART 2
Disaster! There has been an oil spill off the coast of Santa Barbara.
It is your job as a NOAA Oceanographer to do everything possible to reduce the impact of the oil
spill on the coastal environment. There are 10 miles of booms available at the NOAA response
station in Santa Barbara, but more booms and other coastal cleanup materials need to be loaded
and driven from the Los Angeles – this will take 24 hours.
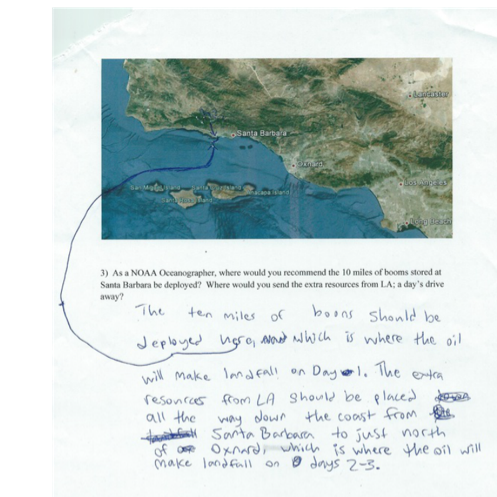
You must decide where to deploy the 10 miles of booms in Santa Barbara and what to do with
the remaining resources available a day later.
Once again, my partner and I put in the real-time local forecast for Santa Barbara for the days we were doing this activity (Dec. 3, 4, and 5)
Today’s Weather Conditions:
Current: Winter (Sep-Feb) choose “Relaxation”
Spring (Feb-May) choose “Upwelling”
Summer (June-Aug) choose “Convergent”
Wind: 10 knots, ESE (all three days) or consult the local forecast.
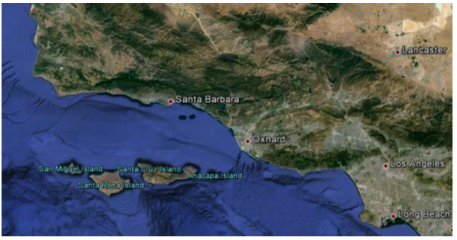
- Spill Location: 34° 19’ 54’’ N and 119° 36’ 47’’ W
- Spill Amount: 100,000 barrels (non-weathering)
Once again, we ran the simulation and answered the following questions:
2) Where did the oil make landfall after the first day? How about the second and third
days? You can indicate on the map: (EXCUSE MY PARTNER'S HANDWRITING)
It is your job as a NOAA Oceanographer to do everything possible to reduce the impact of the oil
spill on the coastal environment. There are 10 miles of booms available at the NOAA response
station in Santa Barbara, but more booms and other coastal cleanup materials need to be loaded
and driven from the Los Angeles – this will take 24 hours.
You must decide where to deploy the 10 miles of booms in Santa Barbara and what to do with
the remaining resources available a day later.
Once again, my partner and I put in the real-time local forecast for Santa Barbara for the days we were doing this activity (Dec. 3, 4, and 5)
Today’s Weather Conditions:
Current: Winter (Sep-Feb) choose “Relaxation”
Spring (Feb-May) choose “Upwelling”
Summer (June-Aug) choose “Convergent”
Wind: 10 knots, ESE (all three days) or consult the local forecast.
- Spill Location: 34° 19’ 54’’ N and 119° 36’ 47’’ W
- Spill Amount: 100,000 barrels (non-weathering)
Once again, we ran the simulation and answered the following questions:
2) Where did the oil make landfall after the first day? How about the second and third
days? You can indicate on the map: (EXCUSE MY PARTNER'S HANDWRITING)
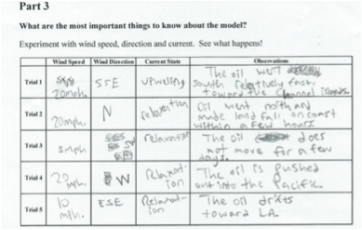
In part 3, we simply experimented in the GNOME program with several variables, and recorded our results, listed at right.
My partner and I mainly just changed the wind direction and speed, but also adding more oil barrels spilled was pretty fun as well.
CONCLUSION QUESTIONS:
1) What are some important variables in the model? Why are they important? Which do you think are the most important variables that determine where the oil will end up?
I think the two most important variables are wind speed/ direction and current. Both are very important and also are the most important that determine where the oil will end up.
2) What kinds of things changed when you made changes to the wind speed and direction?
What happened when you changed the current?
The amount of shoreline covered in oil changed greatly when we changed the wind speed and direction. When wind speed was turned up, the oil started moving faster, and the oil slowed down when we slowed the wind down. When the current changed, the oil's speed and direction changed a little bit, but not very much.
3) The Channel Islands contain a delicate marine ecosystem. What kinds of conditions would
threaten the Channel Islands if there were an oil spill in Santa Barbara channel.
An upwelling current instead of a relaxed current, along with an south-eastward moving wind would send most of the oil towards the islands.
4) Although this model was actually used by NOAA, it is several years old. Newer versions
take several other factors into account. Can you think about other things that may affect how oil
moves around that aren’t modeled in this simulation and would improve the accuracy of the
model?
Yes. Temperature might affect the oil spill, because it might change the speed of the oil. I think it is probably included in newer versions of GNOME.
THIS WAS AN OVERALL GREAT LAB!
